

This content of this portal has been taken from the Ship-Port Interface Guide – Practical Measures to Reduce GHG Emissions, developed by the IMO-Norway GreenVoyage2050 Project and members of the Low Carbon GIA.
Download the guide here.
International efforts to address GHG emissions include the Paris Agreement and its goals, and the United Nations 2030 Agenda for Sustainable Development and its SDG 13: “Take urgent action to combat climate change and its impacts“. With a view to contributing to global emission reduction efforts, IMO in April 2018 adopted resolution MEPC.304(72) on the Initial IMO Strategy on reduction of GHG emissions from ships, setting out a vision to reduce GHG emissions from international shipping and phase them out as soon as possible in this century.
The Strategy includes a list of candidate short-, mid- and long-term measures which IMO could further develop with a view to achieving the ambitious targets as set out in the Strategy. As part of the list of candidate short-term measures, the Strategy calls for the encouragement of port developments and activities globally to facilitate reduction of GHG emissions from shipping, including provision of ship and shoreside/onshore power supply from renewable sources, infrastructure to support supply of alternative low-carbon and zero-carbon fuels, and to further optimize the logistics chain and its planning, including ports.
Furthermore, the important role of ports in the wider supply chain and the action that ports can take to facilitate the reduction of GHG emissions from shipping has been recognized through the adoption of resolution MEPC.323(74) in May 2019 on Invitation to member states to encourage voluntary cooperation between the port and shipping sectors to contribute to reducing GHG emissions from ships.
With a view to supporting the maritime industry in achieving IMO’s emission reduction goals and contributing to greener shipping, this Guide is a Call for Action to port and shipping sectors to facilitate the reduction of GHG emissions in the ship-port interface. This Guide is a particularly useful document for shipowners, ship operators, charterers, ship agents, shipbrokers, port authorities, terminals and nautical services providers, and other relevant stakeholders, who ultimately play a key role in implementing the necessary changes and facilitating the uptake of emission reduction measures in the ship-port interface.
This Guide presents several practical measures that:
With the average economic lifetime of a ship of approximately 25 years[1] and the prospect of zero emission ships entering the market from 2030 onwards, measures that have relatively short payback times with additional benefits for safety and security can be considered low-risk investments.
With this in mind, this Guide presents eight practical measures that can be implemented with limited capital. The measures have not been ranked in terms of emission reduction potential, but have been ordered into measures related to port operations, administrative data, nautical data and speed optimization as follows:
The Guide presents an explanation of each of these measures and identifies how their implementation can lead to GHG emission reductions and further benefits for the maritime sector (e.g. for the safety and security of shipping). Barriers to the global implementation of each measure are identified and preliminary potential solutions and next steps are suggested which could be taken to progress implementation further.
Annex 1 of this Guide provides an idea of the potential fuel savings which can be achieved through implementation of some of the measures presented in this Guide. Data used in this Guide is based on real fuel consumption data and was provided and analysed in-kind by two Low Carbon GIA members (A.P. Møller-Mærsk A/S and the Port of Rotterdam).
It should be noted that while the Guide in general refers to GHG emissions, the calculations presented in the annex show the differences in potential fuel consumption. The calculations therefore provide only an indication of the potential CO2 savings, under the specified conditions, and further deeper analysis of the fuel and emission reduction potential of each measure is required.
The eight measures presented in this Guide have been selected for their potential application on a global scale. Measures can be implemented individually as well as collectively, which would maximize the emission reduction benefit. Some of the measures would be applicable each time a ship calls a port (e.g. simultaneous operations, pre-clearance), while others may be applicable less frequently but can have a large impact on fuel consumption (e.g. immobilization, hull and propeller in-water cleaning). Measures such as Onshore Power Supply (OPS) fall outside the scope of this Guide, given the higher capex.
The list of presented measures is non-exhaustive and should serve to raise awareness of preliminary ideas which the maritime community could potentially implement. Recognizing that every port is different and has its unique challenges and characteristics, readers are encouraged to use this Guide as a starting point for discussions and explore these opportunities further within their own port community. Furthermore, the cost of implementation of each of these measures is difficult to assess given the variety of stakeholders involved in their implementation and therefore, the applicability of each measure should be individually assessed for each port and, if needed, explored to see how their uptake could be incentivized.
It should be noted that in all cases, measures to reduce GHG emissions in the ship-port interface will require a triangular collaboration (between ships, ports and terminals) and that none of these measures can be implemented by one stakeholder alone. Furthermore, the speed of implementation will largely depend on the strength of that collaboration and the willingness of all stakeholders to play a part, even if they may not be the direct beneficiaries.
Annex 2 of this Guide reflects the outcome of the interviews with the Port Authority of selected WPCAP Ports (container, ferry and multi-modal ports) on the implementation of the Measures presented in this Guide. The interviews with the ports concentrated on the measures which were implemented and the concerns and barriers to implement further measures. In general all interviewed ports indicated that guidance from a respected organization (e.g., the IMO) would assist the Port Authority with the implementation of measures.
This Guide has been developed by the Global Industry Alliance to Support Low Carbon Shipping (Low Carbon GIA), a public–private partnership originally established under the framework of the GEF-UNDP-IMO Global Maritime Energy Efficiency Partnerships Project (GloMEEP Project). The Low Carbon GIA was launched with the aim to identify and develop innovative solutions to address common barriers to the uptake and implementation of energy efficiency technologies and operational measures. Since January 2020, the Low Carbon GIA has been operating under the GreenVoyage2050 Project, a joint IMO-Norway initiative to support implementation of the Initial IMO GHG Strategy.
This Guide, based on research and discussions undertaken by members of the Low Carbon GIA and other subject matter experts in this field, does not intend to showcase fully developed measures. Instead, this Guide presents initial ideas which require further work and deeper assessment.
Looking into the near future, Low Carbon GIA Members will, based on this Guide and bringing together ports, shipping lines and terminal operators, encourage implementation of these practical measures. With a view to contributing to scaling-up and increasing the uptake of these ship-port interface measures, experiences and best practices will be shared with the global maritime community and contribute to future iterations of this publication.
[1] https://www.statista.com/statistics/1102659/average-age-of-ships-scrapped-worldwide/

Implementation of this measure would allow for maintenance and repairs of the main engine (ME) to occur simultaneously with cargo operations. This would contribute to a reduction in GHG emissions as it would optimize the time spent in port, and eliminate the need for the ship to transit to another location for work to be undertaken.
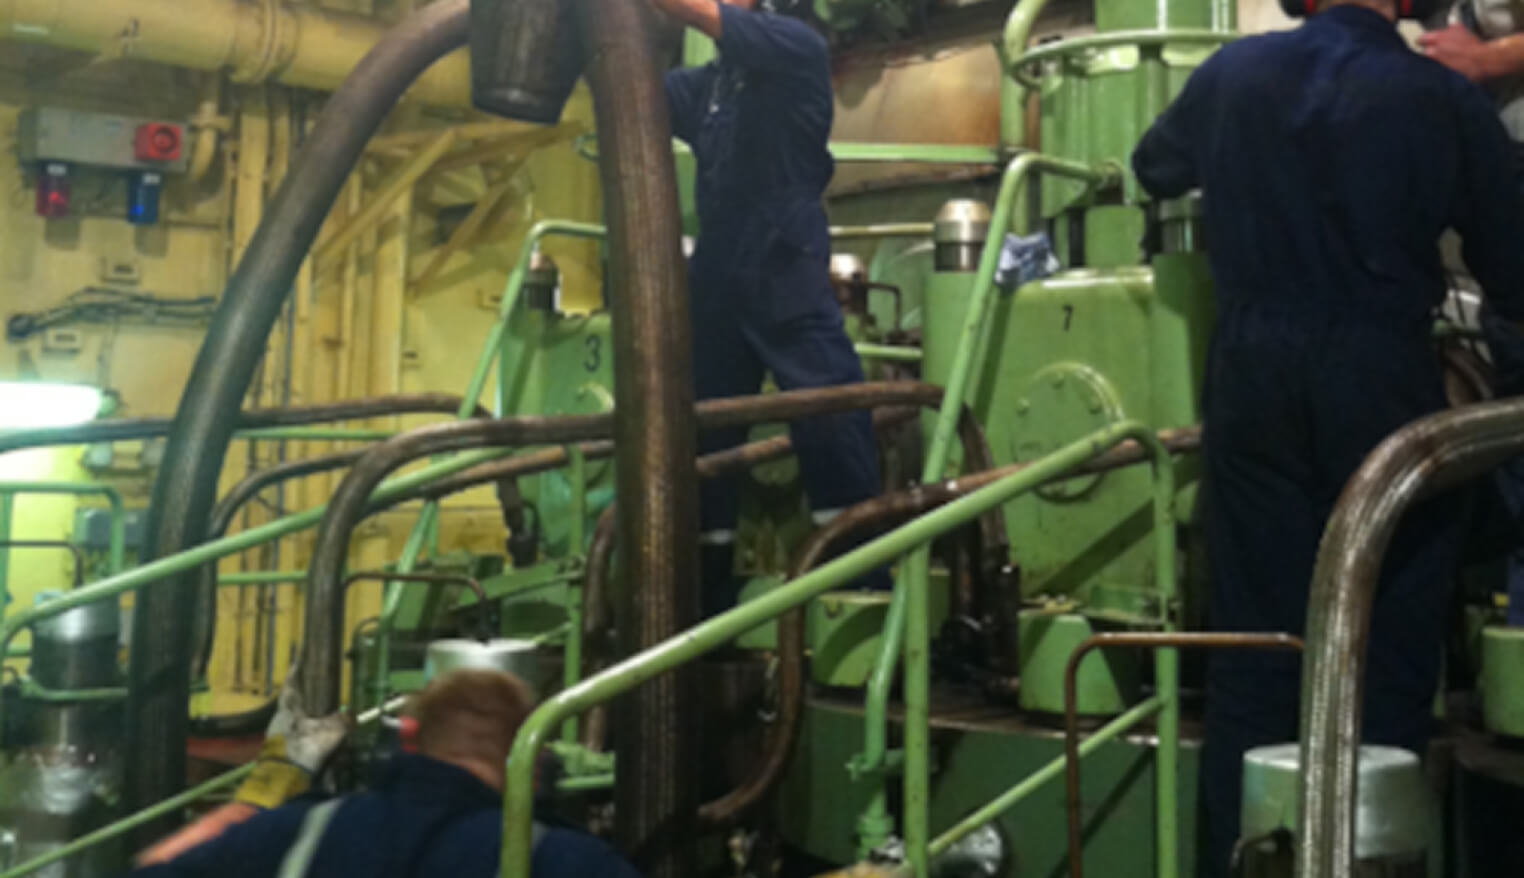
In many ports, maintenance and repairs of the main engine are performed at a lay-by berth, outside of the normal ship schedule. Subsequently, ships may need to speed-up to recover the lost time and meet their voyage onward schedule, negatively impacting on emissions (both in port, due to the longer port stay, and at sea, due to higher transit speeds).
Allowing ships to undertake ME maintenance and repairs simultaneously with cargo operations would reduce the time spent in port. As most ships only have one main engine, once repairs have started, the ship cannot depart from her berth under own power. This condition is called “immobilization” and is not currently permitted by many port authorities.
Main engines of ships on average have 6 to 10 cylinders. While new container ships could have 2 MEs with 7 or 8 cylinders each, older container ships may only have 1 ME with 10 to 14 cylinders. Each cylinder has many different components (e.g. fuel pump, fuel injector, exhaust valve, piston ring or cylinder liner) which may require planned maintenance or unplanned repairs. Proper functioning of these components is critical to maintaining the engine in a condition that combustion is optimal (i.e. causes the least possible emissions under any given engine load condition).
The duration of maintenance jobs may range from 3 hours (e.g. exchange of a fuel injector) to 12 hours (e.g. replacing a piston) and up to 24 hours (e.g. replacing a cylinder liner). The frequency of maintenance jobs also varies per type and make of engine and component, e.g piston rings need replacement approximately every 16,000 running hours, an exhaust valve overhauled after 16,000 running hours and a fuel injector after 8,000 running hours. Depending on engine load and quality of fuel and lubrication oil, there is a tendency for condition-based maintenance in lieu of running hours-based maintenance. All maintenance is required to be in compliance with class requirements.


Ports of Bremerhaven, Gothenburg, Hamburg and Rotterdam allow maintenance to main engines and grant immobilization under normal weather conditions.
In general immobilization for repairs is granted in the interviewed ports. There may be additional requirements such as repairs not exceeding the allocated time for cargo operations and (hot) work in relation to dangerous cargo.

Implementation of this measure would allow hull and propeller cleaning to take place in port, ideally simultaneously with cargo operations. This would contribute to a reduction in GHG emissions as it would optimize the time spent in port and eliminate the need for the ship to transit to another location for hull and propeller cleaning to be performed, as well as the reduced GHG emissions as a result of the hull and propeller cleaning itself.
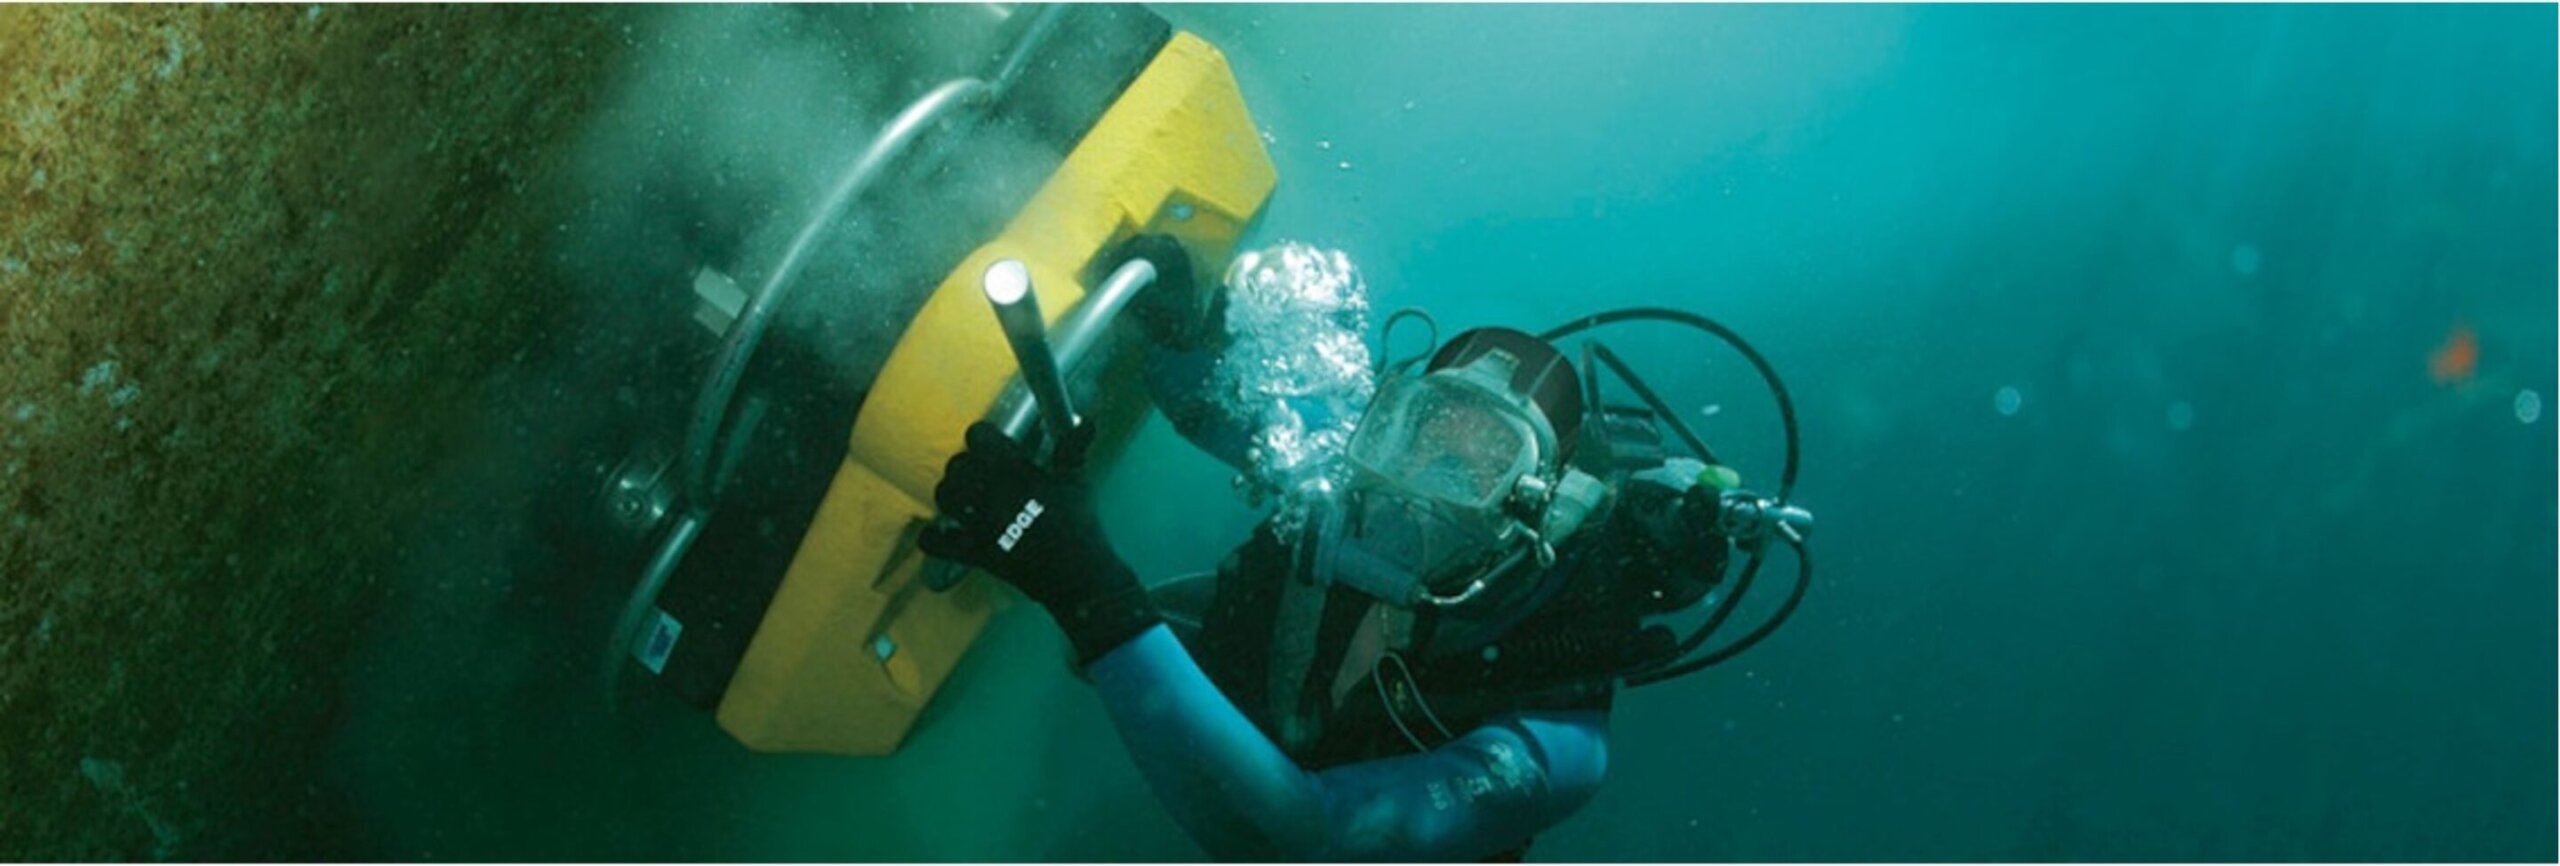
Many ports do not currently allow hull and propeller cleaning during the port stay. As a consequence, it can be challenging for ship operators to maintain a clean hull and propeller, which would reduce resistance of the hull and propeller through the water while steaming. Hull and propeller fouling results in increased fuel consumption and hence higher GHG emissions. Therefore, it is important for ships to regularly clean their hull and propeller. Allowing ships to clean their underwater hull and propeller, ideally simultaneously with cargo operations alongside, will optimize the time it spends in port and avoid that the ship may have to speed up in order to make up for lost time.
Hull and propeller cleaning does not need to be undertaken at every single port call and also largely depends on the trading pattern and region where the ship trades. Cleaning the hull too early may damage the anti-fouling coating system, which could in turn increase fouling.
Some ports do not allow in-water cleaning at all due to sediment/scrapings of the hull and propeller cleaning process entering the port waters, and in this respect the industry has developed the first industry standard on in-water cleaning with capture.[2]


Ports of Algeciras, Antwerp, Ghent, Gothenburg, Rotterdam, Zeebrugge
Due to these barriers, local authorities often do not issue operating permits to hull and propeller cleaning companies.
The majority of ports does have provisions for propellor cleaning. Hull cleaning does have an environmental concern and often the environmental administration is involved as well. Concerns on diving operations in relation to manoeuvring in port and the use of the ballast system. Contractors may be subject to specific demands from Port Authority

Implementation of this measure would allow operations to occur simultaneously (e.g. cargo, bunkering, provisioning, tank cleaning etc.). This would contribute to a reduction in GHG emissions as it would optimize the time spent in port, as operations can be concluded in parallel rather than in sequence.
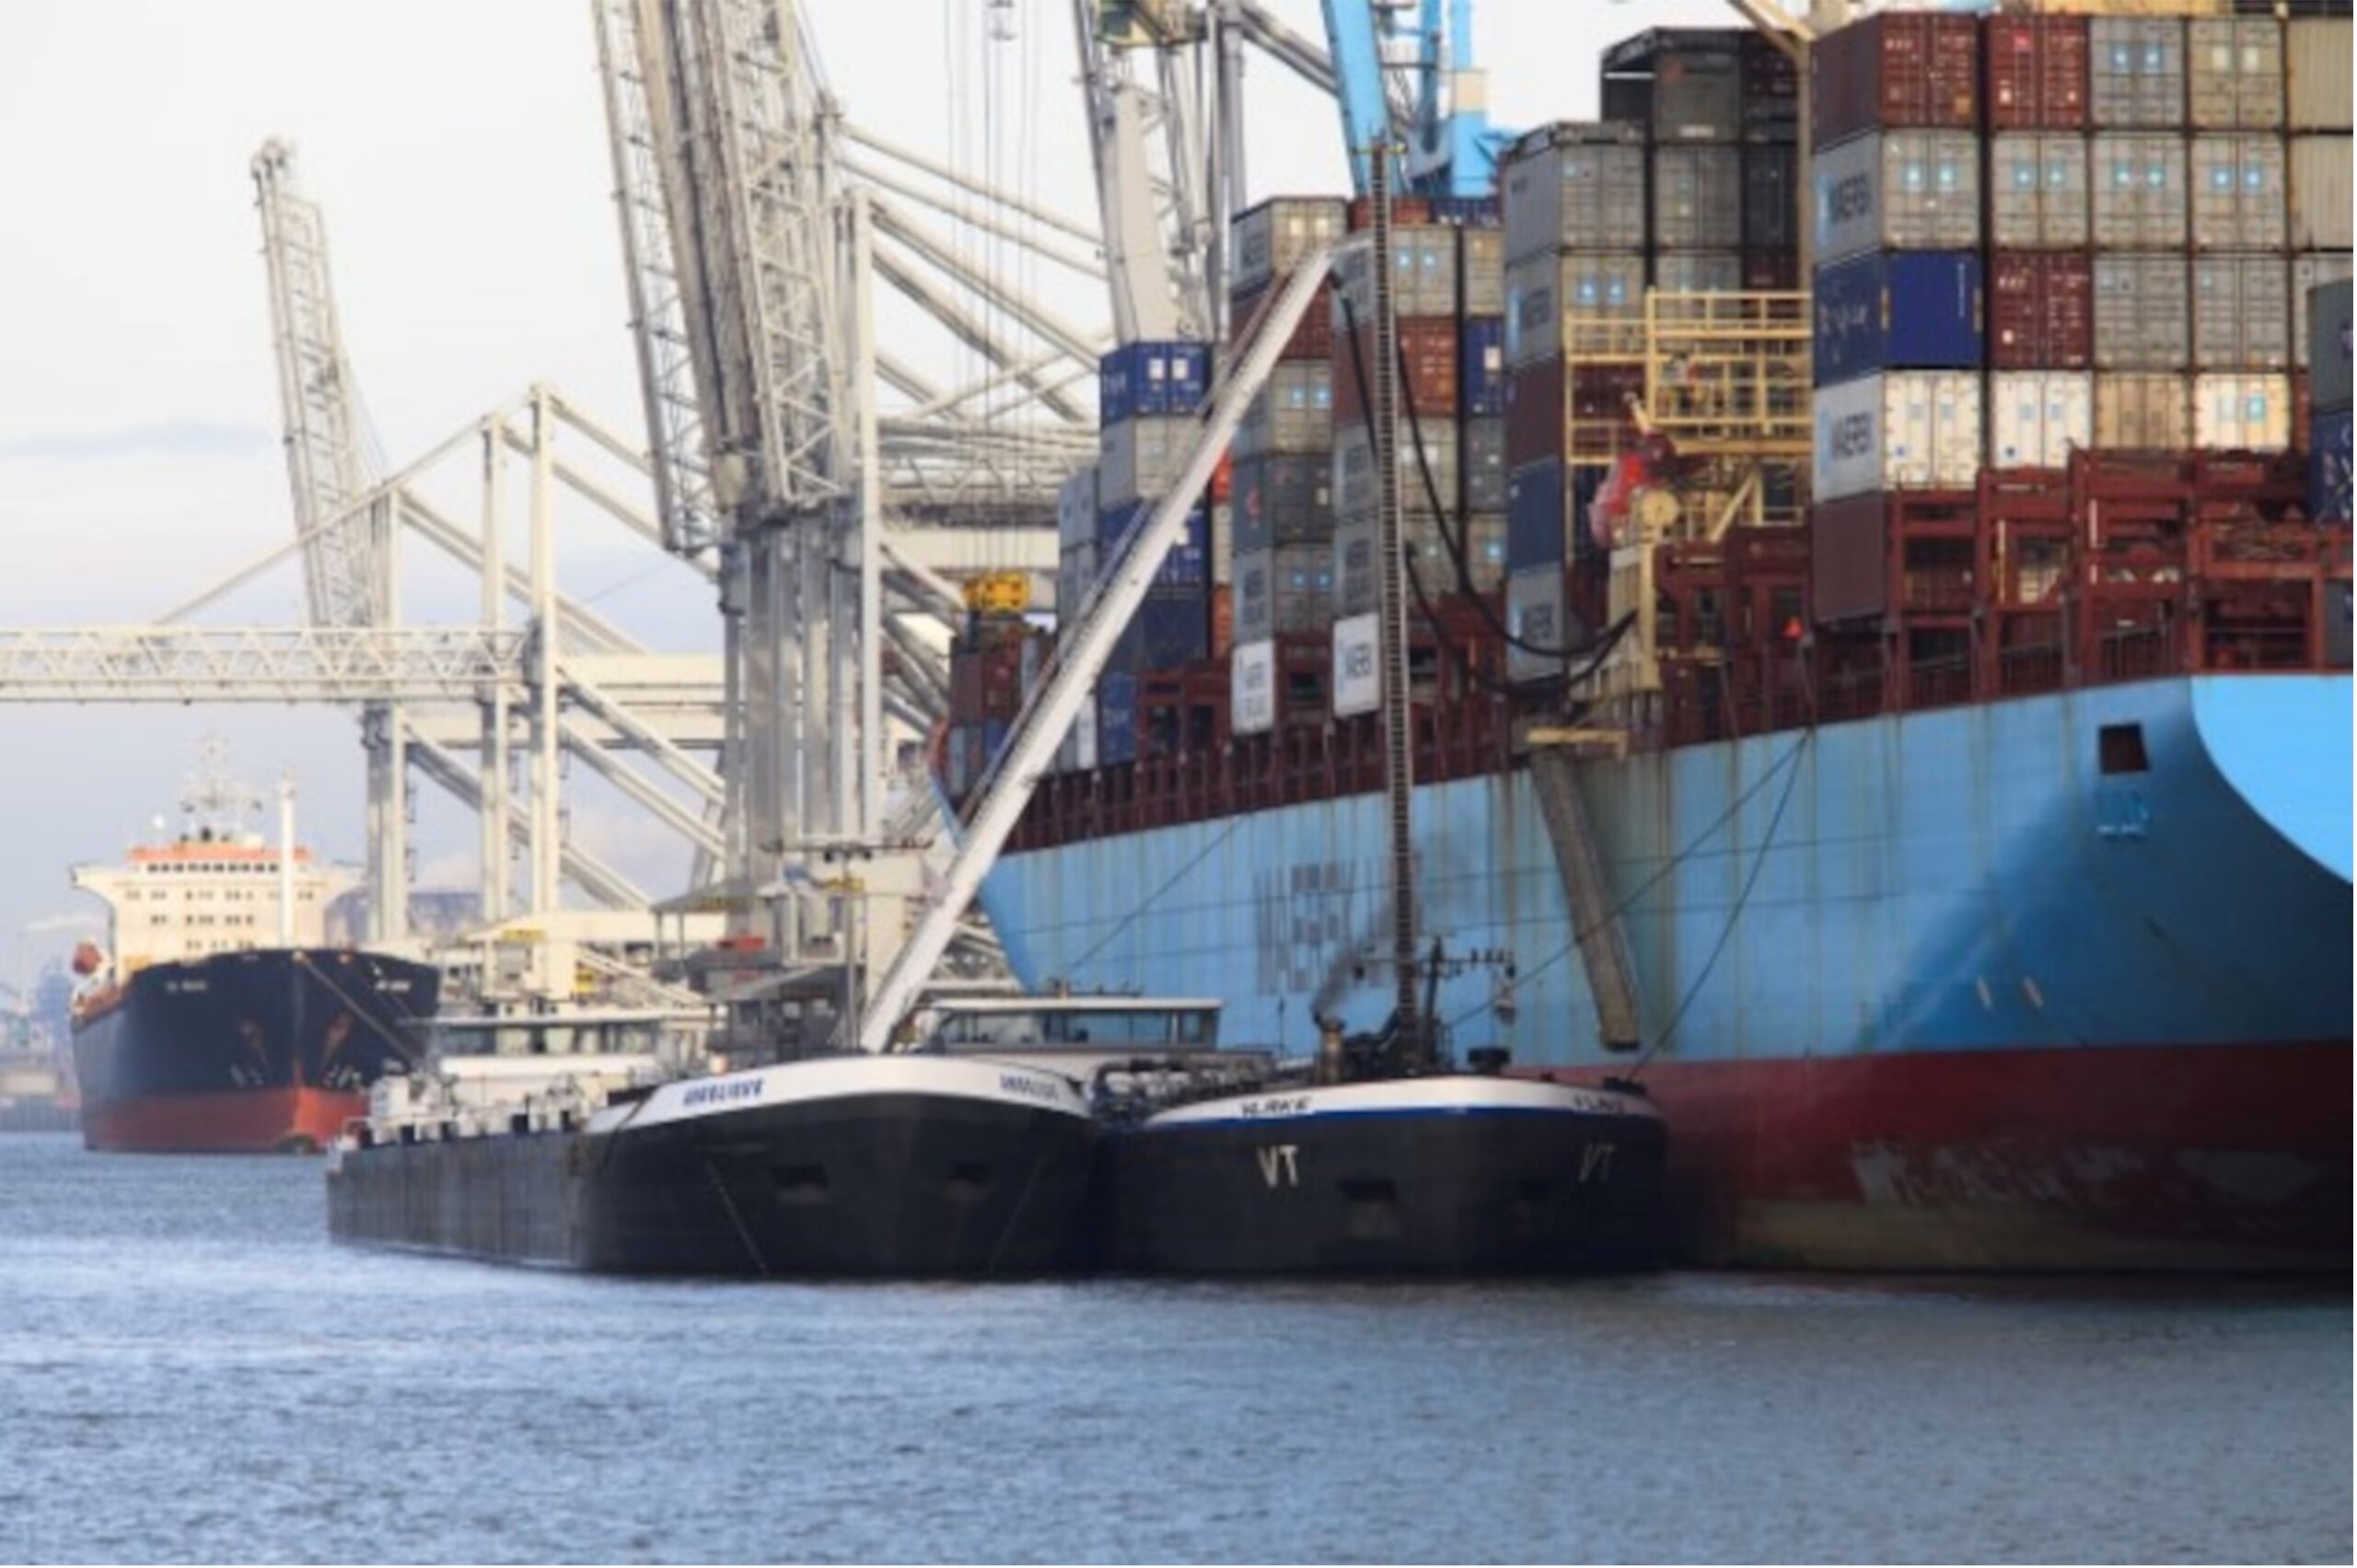
Depending on the size of the ship and the capabilities of the port, bunker operations would normally require a minimum of 6 hours, while taking provisions, spares or consumables on board could require about 1 to 4 hours. These operations fall under the responsibility of different onboard departments (i.e. bunker operations are normally under the responsibility of the chief engineer, while cargo operations are under the responsibility of the chief officer). Therefore, these can occur simultaneously, taking into consideration that crew rest hour requirements are not compromised.
Bunkering of HFO during cargo operations is allowed in most ports. In the tanker segment this is sometimes prohibited by the terminal. Bunkering of LNG is more often than not allowed during cargo operations; however, it is becoming available in a wider range of ports, such as Ports of Barcelona, Gothenburg and Rotterdam.
This is generally allowed in the interviewed ports. One port required the consent of the terminal operator and one port required completion of Simops prior end of cargo operations.

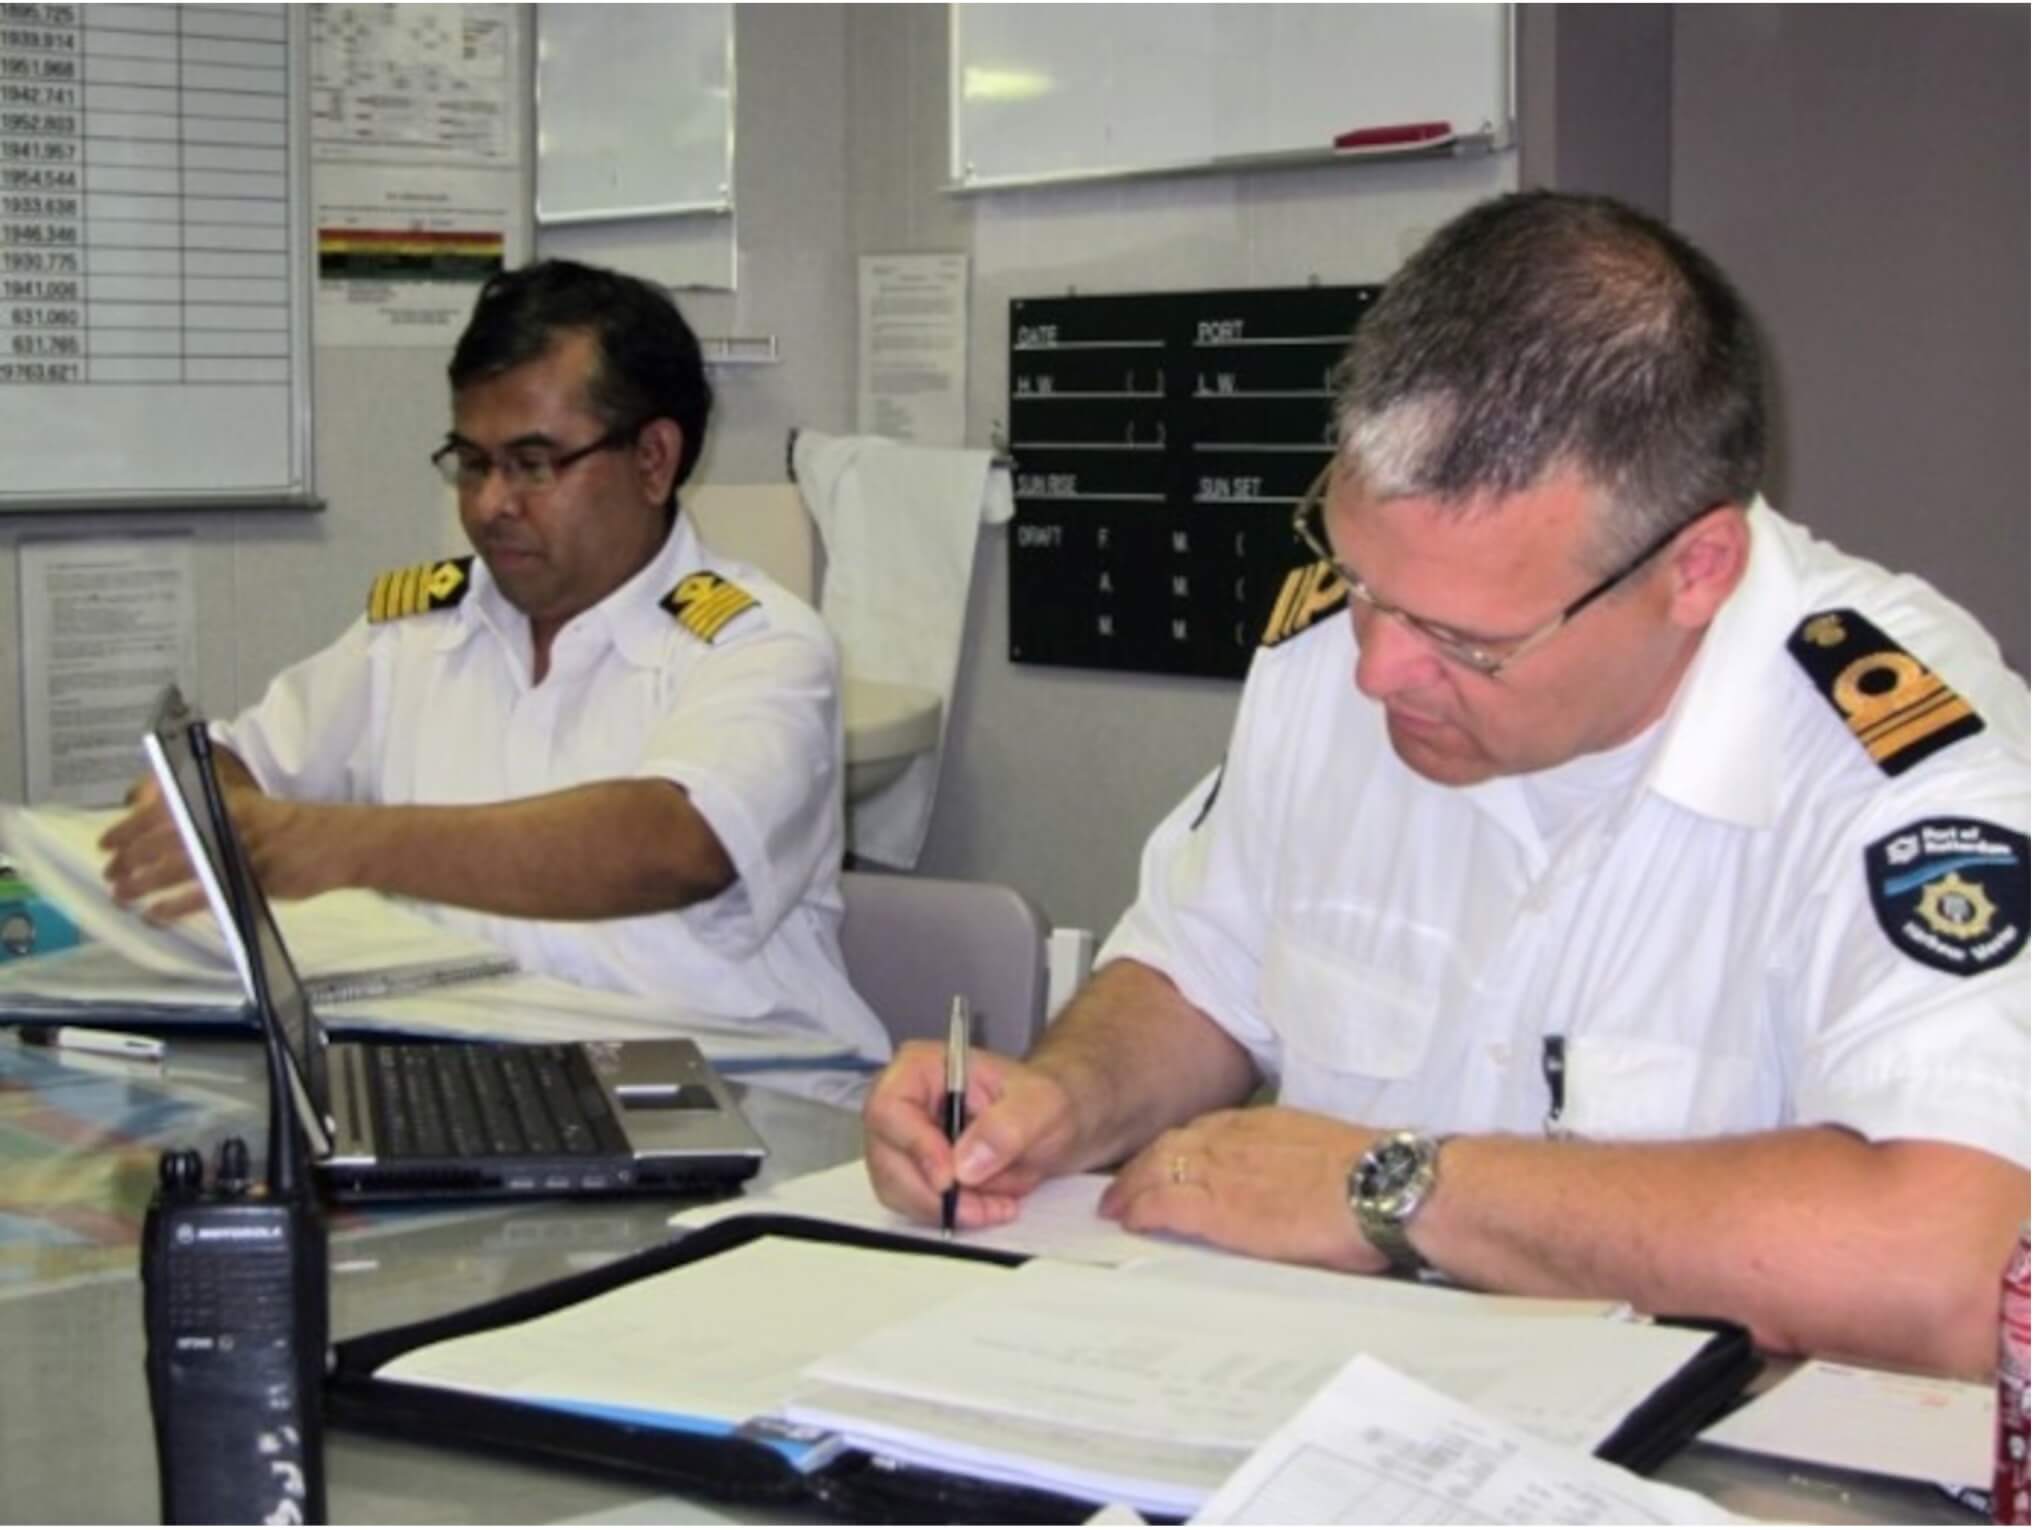
This measure optimizes the port call and aims to eliminate unnecessary waiting time by facilitating all required clearances in advance, thereby contributing to a reduction in GHG emissions through the optimized port stay.
Ships may experience operational delays on arrival, during port operations or at departure due to clearance processes in ports. The delays may need to be recovered in transit, often resulting in higher transit speeds, and thereby increased fuel consumption and emissions. Port stay optimization can be supported by introducing pre-clearance of e.g. customs, immigration, port health or port authority formalities, avoiding waiting time to arrive, during operations alongside or to depart, in line with standard 2.1.2 of the FAL Convention: “Public authorities shall develop procedures for the lodgement of pre-arrival and pre-departure information in order to facilitate the processing of such information for the expedited subsequent release/clearance of cargo and persons.”
Notifications and declarations must be provided by the ship to the authorities concerned for cargo and persons’ clearances. Typical clearances are granted by customs, immigration, port health and port authorities. Furthermore, there are additional clearances required on the cargo side (e.g. cargo sampling/checks to ensure quality) although this may be dependent on ship segment.
Frequently, ships face delays on arrival or departure because clearances from the relevant authorities have not been obtained. In some cases, ships may anchor, wait for port clearance, and retrieve anchor before proceeding to the port, which takes considerable time. E.g. not having received port health clearance (free pratique) can lead to delays in entering the port, and not having received customs clearance can delay the start of cargo operations, and lead to idle waiting time alongside. These delays, many of which are experienced on arrival, lead to an increased number of port hours versus planned port time, the timing of which can typically range from half an hour up to 5 hours.
Normally, the ship agent sends the reporting and data format requirements to the ship. The Master compiles and completes this data, which can be resource intensive (as the authorities in most countries require their own format), and returns it to the ship agent, who then processes this data into an electronic application (e.g. maritime single window, port community system). Since April 2019, in accordance with the revised requirements in the FAL Convention, public authorities have to establish systems for the electronic exchange of information, and hard copies are only allowed in case of force majeure where means of electronic transmission are unavailable.
In most ports it is unknown if and when authorities are boarding the ship. Often authorities board the ship at different times. Immigration officers may come on board at any time, forcing all crew to wake up for a “face check”, custom officers may board several hours later. Both can significantly impact crew rest hours, causing even a violation of rest hours (and hence the Maritime Labour Convention, MLC).
The current situation is expected to improve over time; however, it requires acceleration. A group of global industry associations in consultative status with IMO representing the maritime transportation and port sectors, consisting of IAPH, BIMCO, ICHCA, ICS, IHMA, IMPA, IPCSA, ISSA, FONASBA and the PROTECT Group, issued a joint statement on 2 June 2020 calling for intergovernmental collaboration to drive the acceleration of digitalization of maritime trade and logistics. In addition, owing to the COVID-19 pandemic, many port authorities do not board the ship anymore, demonstrating that physical presence is not necessarily required to clear the ship.
Port of Singapore has implemented pre-clearance.
This is unanimously done by all ports, also intensified due to the COVID-19 pandemic.

This measure aims to improve the planning of ships calling at multiple berths in one port, as is often the case with container feeder ships, chemical and parcel tankers. This measure aims to ensure:
Addressing the planning would result in lower GHG emissions as the ship’s time under engine in port, the terminal operations as well as all services ordered (e.g. nautical service providers) are aligned which result in improved port turnaround times and present an opportunity for bunker savings in subsequent voyage to the next port of call, thereby contributing to a reduction of GHG emissions.
Today, ship agents need to collect information from all sources, usually by phone, which is very labour intensive and inefficient. There is a huge dependency on the manual follow-up of any unforeseen changes in port operations delivered to the ship, terminal completion times, completion of bunker provisions, booking of pilots and tugs etc. The process of updating all parties involved is fragmented and extremely manual in terms of manpower. While shipping is a 24/7 operation, not all crucial stakeholders might be available around the clock.

This is further exacerbated when ships call at multiple berths in one port (which is common for container feeder ships, chemical and parcel tankers) as there is no overview of the berth planning for multiple berths. Individual terminals are responsible for their own berth planning, and the port authority is responsible for the port planning. Today, most ports and terminals do not have a neutral unit that acts as a coordinating entity, which has full overview of activity within the port. As a result, the planning of a ship calling at multiple berths in one port is fragmented, and often results in unnecessary ship movements, additional shifting to lay-by berth or waiting times at the terminals, which in turn causes unnecessary GHG emissions.
Improving this coordination would result in an improved turnaround time in port, enabling speed optimization opportunities on the outbound voyage, thereby reducing GHG emissions. This measure would encourage increased exchange of high-quality and up-to-date information in order to improve planning and optimize the port stay.
The ease of implementation will depend on the existing digital infrastructure e.g. a port community system. If such a PCS is present, it may still require a change of procedures to develop the capability to exchange the event data required for implementation of the measure.
Port of Hamburg (with the Hamburg Vessel Coordination Centre (HVCC) acting as a neutral overseeing entity)
This measure was not indicated as an issue. If the use of multiple berths in succesion takes place, it is well coordinated. It predominantly occurs with container feeders and (small) product tankers.

This measure involves improving Port Master Data to ensure that the right ship size is utilized, by:
Having the right ship size utilized results in lower GHG emissions per carried ton of cargo.
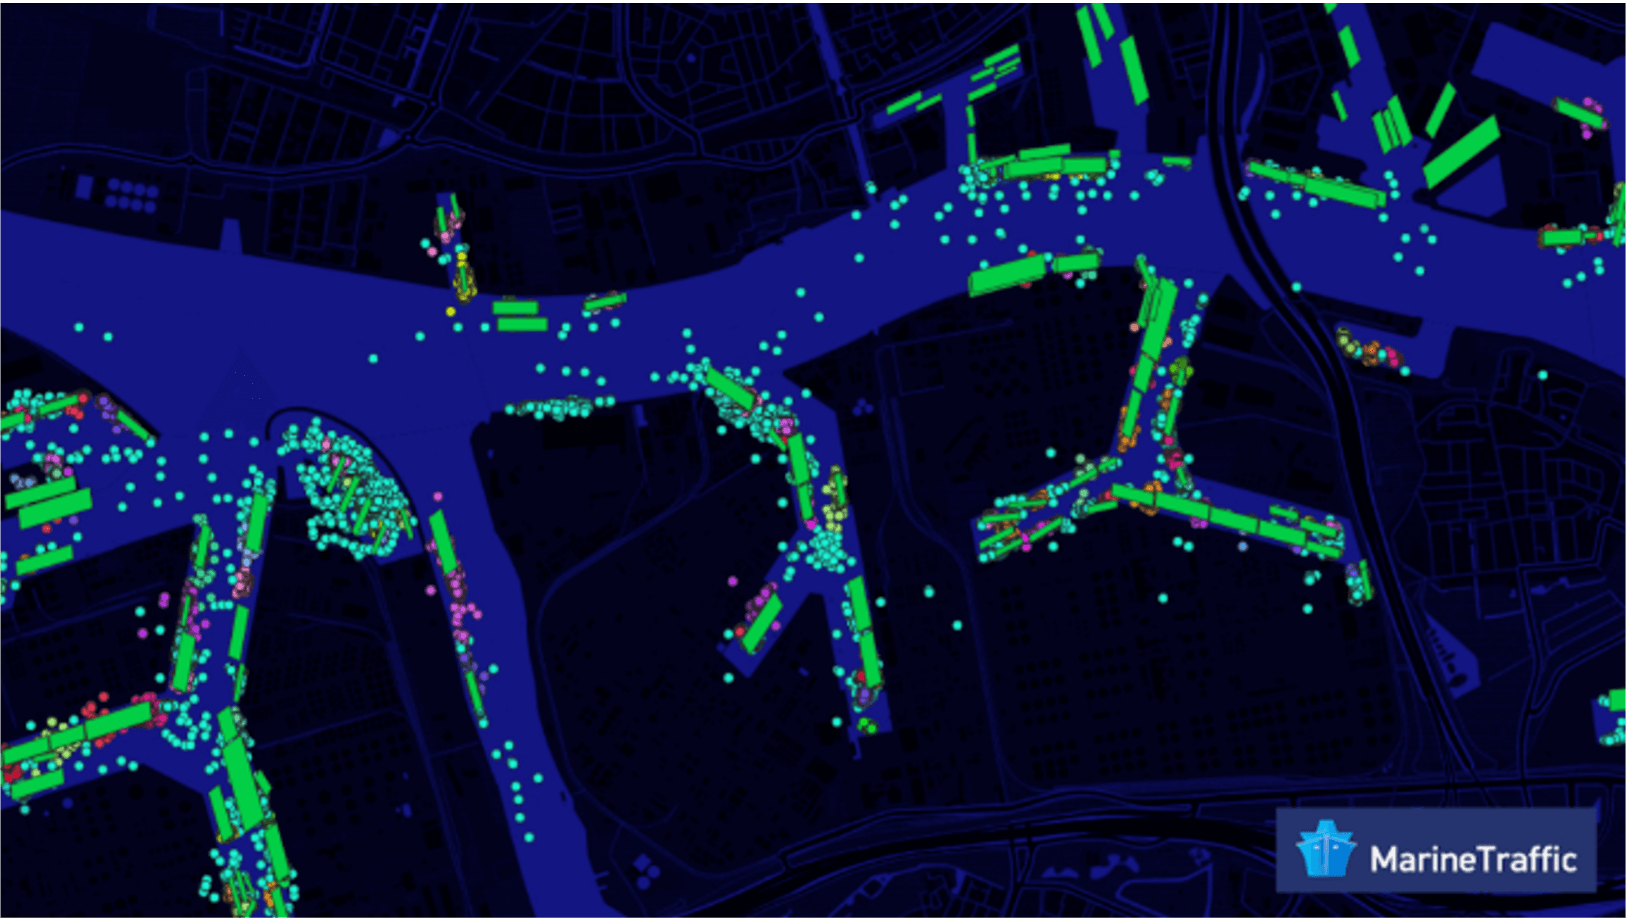
Today, many ports and terminals do not have easily accessible and high quality data available about the maximum ship sizes that can be accommodated. AIS data can increase the understanding of the maximum ship sizes for ports, terminals and berths, based on metadata of many ships calling at a particular port, terminal and berth. This data is key for 85 per cent of the shipping business: deploying the right ship that fits at the berth of both the load and discharge port.
Furthermore, many ports and terminals do not have unique identifiers for individual berths that are used on a global level. This can result in misunderstandings and miscommunications regarding which berth a ship should be going to. Without a common understanding of which terminal and berth the ship should go to, it is difficult to obtain accurate information on the maximum length and beam of the ship that the terminal can accommodate. As a result, a ship may not be optimized for that particular berth.
According to regulation 19 of Chapter V of SOLAS,[3] AIS is compulsory. Data entry in the AIS equipment is also compulsory; however, it is inputted manually and it is not specified in what format. Currently, the metadata inputted for AIS to identify the next port of call is a freetext field (UNLOCODE), which makes it difficult to analyse the data. The UNLOCODE, which is used to identify the port, is typed in manually, allowing for human error and different codes to be used. The terminal and berth identifiers are currently not inputted into AIS. Inclusion of the identifiers for the terminal and berth in the AIS metadata would allow for the proper and efficient identification of the terminal and berth.
Collating all this AIS data from ships could support efficient identification of the next port of call, including identification of the terminal and berth, taking into account ship length and beam. Analysis of this data could contribute to improving the global availability of Port Master Data.
Currently, no ships are completing the AIS data in a uniform fashion.
This point was addressed as an issue, with berths often known, however the berthing position or bollard numbers are generally not indicated in the nautical chart / ENC. There are standardisation projects (IHO standards) underway in various ports to improve on this matter. Not all interviewed Port Authorities see this as an issue.
[3] Regulation 19, Chapter V, SOLAS: “Carriage requirements for shipborne navigational systems and equipment – sets out navigational equipment to be carried on board ships, according to ship type. In 2000, IMO adopted a new requirement (as part of a revised new chapter V) for all ships to carry automatic identification systems capable of providing information about the ship to other ships and to coastal authorities automatically.”

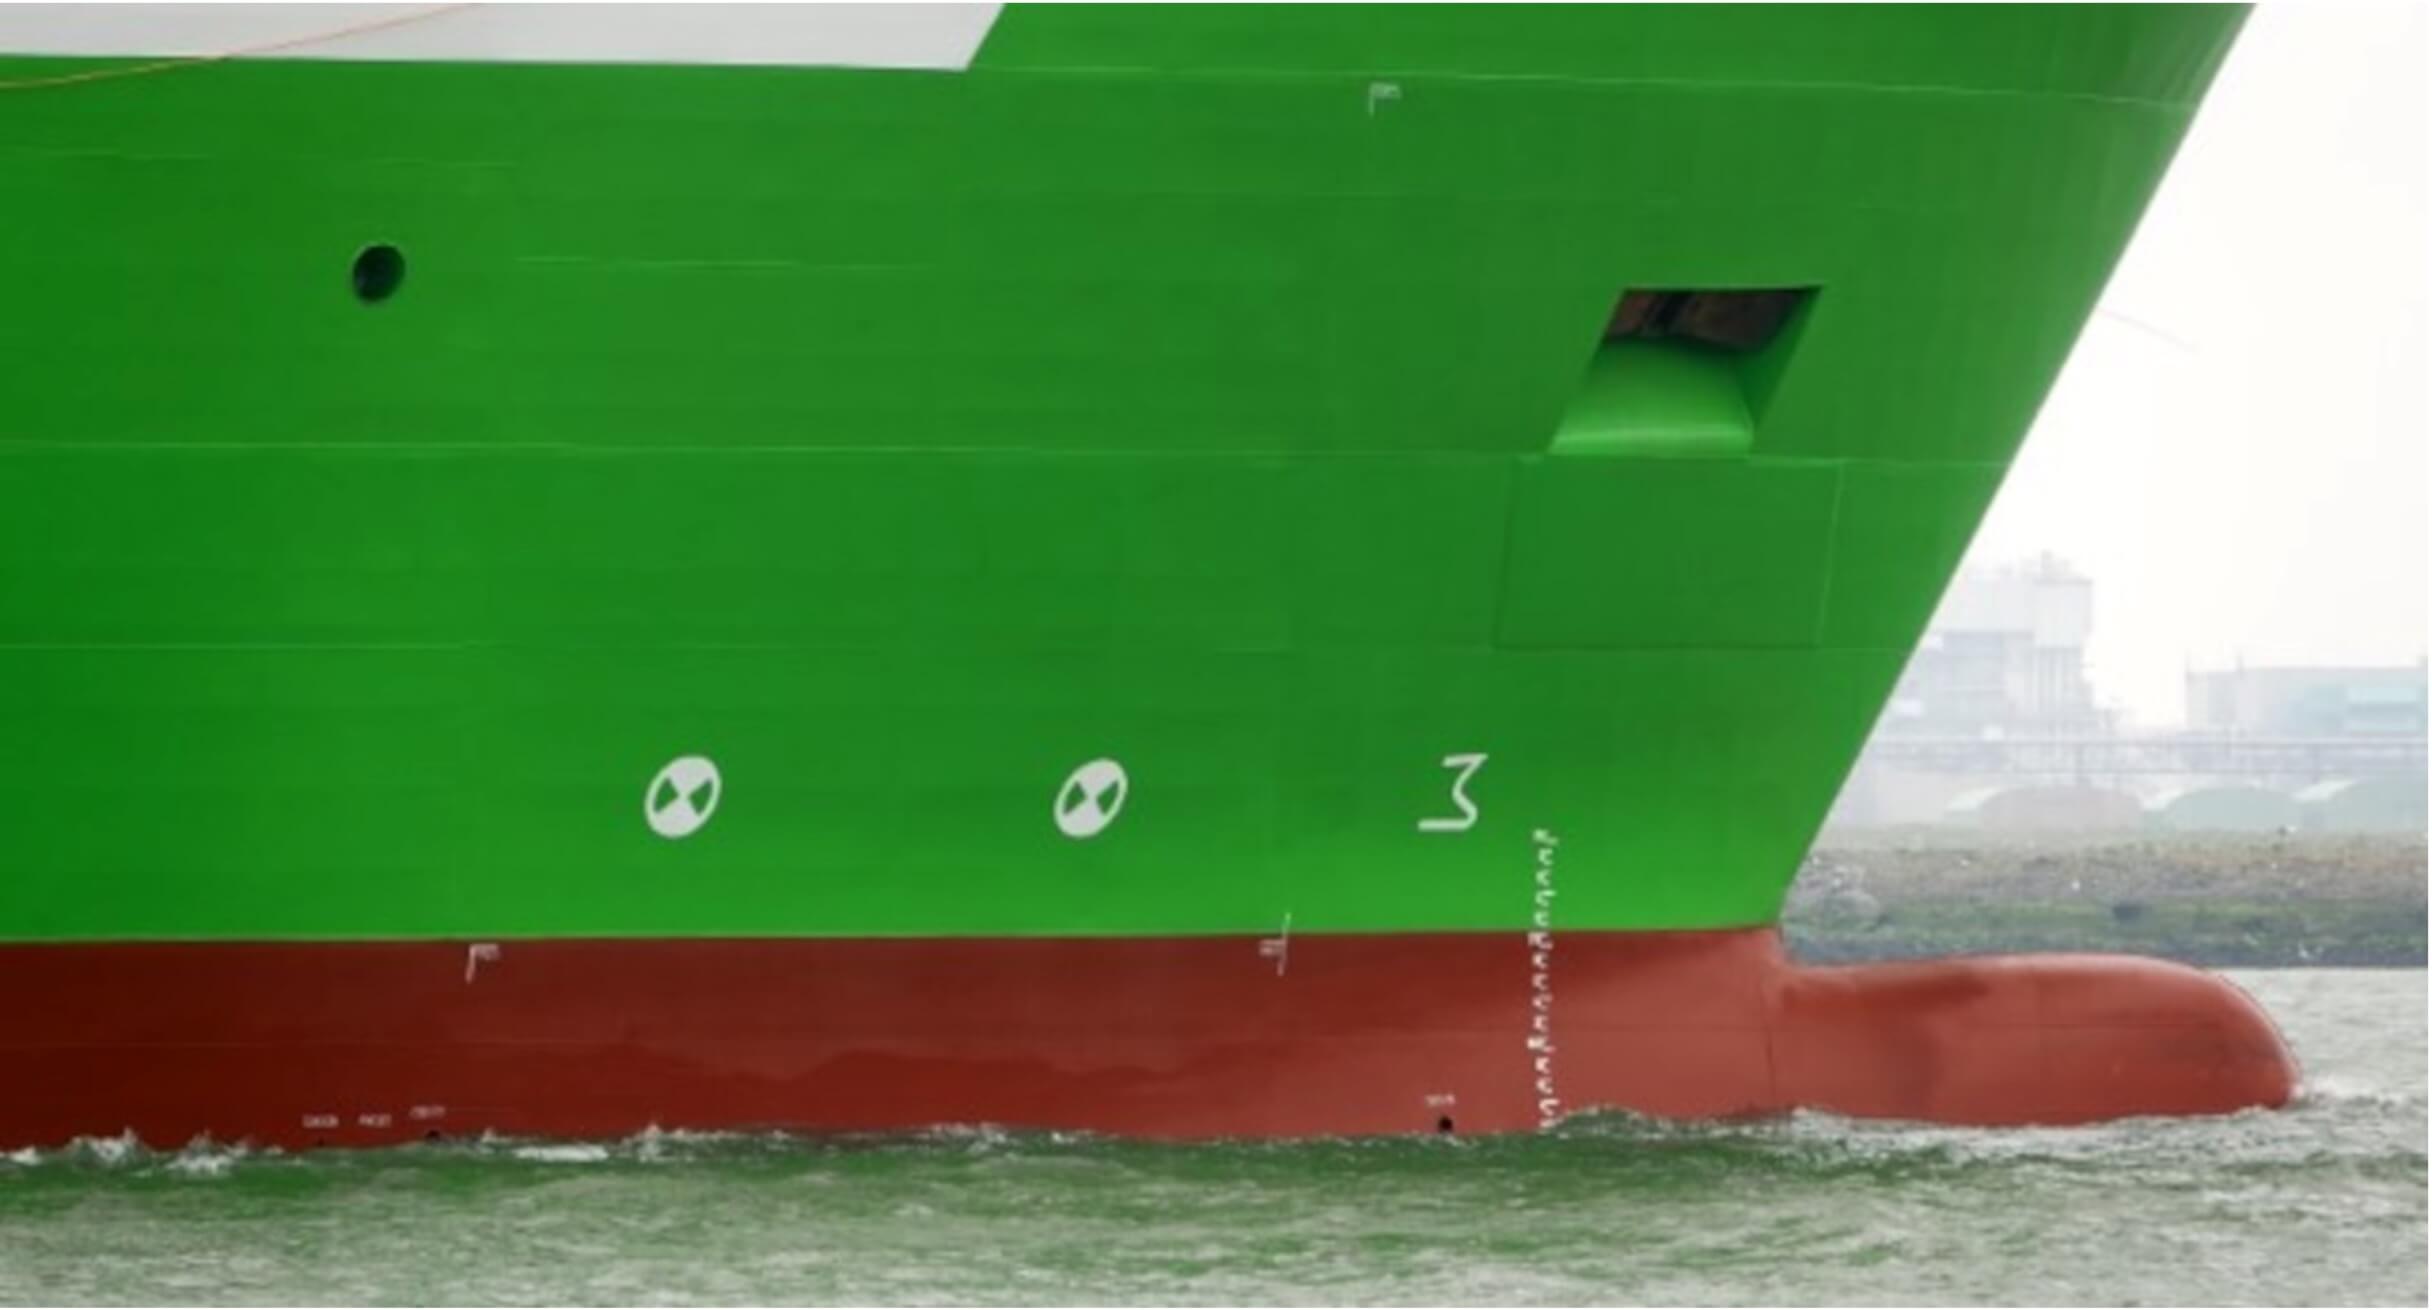
This measure involves improving Port Master Data (depths, water density, tidal heights) to enable optimization of the draught of the ship, eliminating unnecessary allowances and additional buffers in the Under Keel Clearance (UKC).
Improved access to reliable and up to date Port Master Data allows for better optimization of the deadweight capacity and therefore contributes to a reduction in GHG emissions per cargo ton transported.
Today, ships face many challenges in the availability of reliable and up to date Port Master Data, such as the depths of the deep-water route, fairway, harbour basin and the berth pocket. Owing to the lack of this information, many ships sail with under-utilized capacity, as Masters often maintain an additional buffer in the UKC when assessing the allowable draught of the ship on arrival and departure. In applying this measure, and optimizing the deadweight at the loading port, the depth of the discharge port and the approaches in both ports also need to be taken into consideration.
Port authorities face challenges in collecting and publishing port infrastructure data (e.g. name and location of berth, depths). This could be for several reasons (see barriers below), including that the port authority may not be the data owner of all port data (e.g. terminals may be the data owner of depths at the berth). Furthermore, the information gathered is not necessarily shared with the national hydrographic office. Sometimes the data is published directly by the port (e.g. on websites) in a format that conflicts with official ENC, either by different values and/or by different (local) reference levels (Chart Datums, CD). In such cases, the data cannot be readily used.
As a result of this lack of sharing and inconsistency in data formats, some national hydrographic offices are unable to publish this information in their official Nautical Publications (NPs) as they cannot guarantee the correctness of the data. Without access to reliable data, those requiring the information will often resort to collecting the data themselves, through various means such as questionnaires to mariners, ship agents etc. in order to make the most informed decisions, but will take into consideration additional UKC allowances because the data is not verified.
In addition, most NPs do not display the accurate height of tide – usually, only predictions for astronomical tide are displayed. However, since ports are affected by environmental conditions such as wind direction, river flow or barometric pressure, deviations to the astronomical predictions occur. Some ports do publish the local height of tide, but not in a standardized manner and not always with the same timeframe or accuracy.
Most NPs do not display the accurate water density; normally they only display an average water density for the entire port area. Most ports however have different water densities, ranging from e.g. 1025 kg/m3 close to the harbour entrance (sea water) to 1000 kg/m3 further inland (fresh water). Water density may also change with the tide.
To cater for these uncertainties, Masters often apply allowances for the maximum draught in their UKC calculations, especially at the berth, where the ship will also be positioned during low tide.
It should be noted that, in accordance with regulation 9 of Chapter V of SOLAS, “Contracting Governments undertake to arrange for the collection and compilation of hydrographic data and the publication, dissemination and keeping up to date of all nautical information necessary for safe navigation.”
Ports of Brisbane, Cairns The Port of Rotterdam shares its local ENC with the HO and is working to change the format allowing automatic processing of the data. Also, the local Chart Datum (Normaal Amsterdams Peil, NAP) is changed to an international Chart Datum (Lowest Astronomical Tide, LAT).
Some ports are able to receive deep draughted vessels and are not subject to siltation. Other ports experience a considerable lead time from sounding to embedding these depth data in official publications through the official channels. Undertaking dredging was indicated as an environmental challenge.
[4] http://www.emsa.europa.eu/news-a-press-centre/external-news/item /3734-annual -overview-of-marine -casualties-and-incidents-2019.html
[5] The S-44 Publication sets out the “Standards for Hydrographic Surveys”, developed by the International Hydrographic Office (IHO)

This measure would allow for ships to optimize speed between ports, to arrive “Just In Time” when the berth, fairway and nautical services are all available. This “Just In Time Arrival” concept (JIT Arrival) will improve the port call process and ultimately reduce GHG emissions.
Through the application of JIT Arrival, GHG emissions and air pollutants can be reduced in a twofold manner:
The process of a port call nowadays is not really optimized, because of the late availability and inaccuracy of information. This can result in a suboptimal port call process, due to unnecessary waiting time, which in turn results in excess GHG emissions from the ship. Ships, in general, “hurry” at full sea speed to the next port, only to find out that the berth is not available because of e.g. another ship is alongside, the cargo is not available for loading, or there is no tank available for discharging. This results in either having to “wait” outside the port at anchorages for many hours, days or even weeks, or manoeuvre at very low speeds in the port area while waiting for the availability of berth, fairway and nautical services. This “hurry up and wait” ship operation has many disadvantages and from an environmental, safety and economic perspective can be improved significantly.
Sending a Requested Time of Arrival (RTA) Pilot Boarding Place (PBP) (ideally, at least 12 hours before arrival) would allow the ship to optimize its speed to arrive Just In Time at the PBP when the availability of: 1. berth; 2. fairway; and 3. nautical services (pilots, tugs and linesmen) is ensured. This may still include anchor time as the optimized speed may take the ship to PBP before the RTA PBP. In a JITArrival scenario, the RTA PBP is frequently communicated to the ship, thereby enabling the Master to take a decision to optimize the ship’s speed.
JIT Arrival is not to be confused with slow steaming or an average/absolute speed limit. Through the application of JIT Arrival, the overall length or duration of a voyage is not impacted and remains the same. Instead, the voyage overall is optimized – the ship may spend more days sailing, but the aim is to minimize and preferably eliminate waiting time and enable sailing at a speed which gives reduced fuel consumption per mile steamed.
The ease of implementation will depend on the existing digital infrastructure e.g. a PCS. If such a PCS is present, it may still require a change of procedures to develop the capability to exchange the event data required for implementation of the measure.

Port of Newcastle (AU) for bulk sector, ports with locks (e.g. Amsterdam, Ghent), Port of Busan (new port section), Port Everglades for cruise liners.
For further information, please refer to the Just In Time Arrival Guide – Barriers and Potential Solutions (GloMEEP, Low Carbon GIA, 2020).
This is a topic with considerable focus, and generally a ‘work in progress’. There are ports already having implemented Port Call Optimisation and ports having implemented parts of this. One port has a ‘first come – first served’ principle. In order to move this forward, ports are looking at Guidance from a recognized body. There was a clear indication that collaboration between ports, terminals and shipping is an absolute must to advance with this measure. The interviewed Port Authorities are very open to contribute to emission savings from international shipping.
[6] IMO GIA Just In Time Arrival Guide
[7] https://www.bimco.org/contracts-and-clauses/bimco-clauses/current/just-in-time-arrival-clause-for-voyage-charter-parties-2021
The information set out in this annex aims to provide an idea of the potential fuel savings which may be achieved through implementation of some of the measures presented in this Guide. Data used in this Guide is based on real fuel consumption data and was provided and analysed in-kind by two Low Carbon GIA members (A.P. Møller-Mærsk A/S and the Port of Rotterdam).
It should be noted that while the Guide in general refers to GHG emissions, the calculations presented in this annex show the differences in potential fuel consumption and therefore provide an indication of the potential effect on CO2 emissions.
In all of the calculations, the fuel consumption data used was that of a large containership (ULCV / 16000 TEU).
The calculations are in no way absolute and any reduction in fuel consumption stated in these calculations should not be considered a reflection of all ship types and voyages. The calculations merely provide an indication of the potential saving, under the specified conditions.
Where applicable, “Port area” is defined as the area from the Pilot Boarding Place to the berth, and the “Sea area” is defined as the area between the Pilot Boarding Place of one port to the Pilot Boarding Place of the next port.
(immobilization, hull cleaning, Simops, pre clearance, multiple berth planning)
Measures 1 to 5 refer to the optimization of the time a ship spends at port and therefore implementing these measures can reduce the overall length of the port stay and allow for more efficient planning of port and terminal resources.
In the following calculations, it is assumed that not being able to perform Simops (bunkering, provisioning), hull cleaning or repairs to the main engine in the most optimal way (i.e. in parallel as far as possible while the ship is alongside) would lead to the ship having to manoeuvre to another location, such as a lay-by berth/anchorage, which would lead to longer port stay. It is further assumed that the ship would speed up on voyage to the next port in order to compensate for the lost time. While this will not always be the case, and will be dependent on several factors, the calculations assume that the ship will speed up to meet its RTA PBP at the next port. This speeding up would ultimately result in extra fuel consumption and therefore an increase in CO2 emissions. In the calculations, only the extra fuel consumption has been calculated (not the CO2 emissions).
The length of “delay” or extra time spent at port (which could be reduced through implementation of these measures) will naturally vary depending on the circumstances but are typically as follows:
| Delays due to: | Time | Related measure |
|---|---|---|
| Transit to lay-by berth for ME repairs | 12 hours | Immobilization (measure 1) |
| Transit to lay-by berth for hull and propeller cleaning | 9 hours | Hull and propeller cleaning (measure 2) |
| Transit to lay-by berth to complete bunker operations | 6 hours | Simops (measure 3) |
| Transit to lay-by berth to complete provisioning, acquiring of spare parts | 3 hours | Simops (measure 3) |
| Clearances not granted (e.g. immigration, health, security) | 1 hour | Pre-clearance (measure 4) |
| Waiting for transit to next berth for loading/discharge of cargo (at the same port) | variable | Multiple berth planning (measure 5) |
Recognizing that the calculated extra fuel consumption expressed as a percentage of the baseline scenario (i.e. all measures implemented as far as possible and no delays) will vary depending on the length of voyage and therefore the calculations simulate a 24 hr voyage and a 6 day voyage (144 hrs).
| BASELINE SCENARIO ‘NO DELAY’ | DELAY (hours) | ||||||
|---|---|---|---|---|---|---|---|
| 12 | 9 | 6 | 3 | 1 | |||
| 24 hr voyage | Speed needed (knots) | 11.50 | 23.00 | 18.40 | 15.33 | 13.14 | 12.00 |
| Distance 276 nm | Consumption (tons) | 52.2 | 127.2 | 85.6 | 68.2 | 58.8 | 54.0 |
| Extra consumption (tons) | 75.0 | 33.4 | 16.0 | 6.6 | 1.8 | ||
| Extra consumption (%) | 143.6 | 64.0 | 30.7 | 12.6 | 3.5 | ||
| 6 day voyage (144 hrs) | Speed needed (knots) | 11.50 | 12.55 | 12.27 | 12.00 | 11.74 | 11.58 |
| Distance 1656 nm | Consumption (tons) | 313.3 | 337.5 | 330.7 | 324.3 | 318.6 | 315.0 |
| Extra consumption (tons) | 24.2 | 17.4 | 11.0 | 5.3 | 1.7 | ||
| Extra consumption (%) | 7.7 | 5.6 | 3.5 | 1.7 | 0.6 | ||
(deadweight optimization)
For this calculation, the following assumptions have been made:
| Leg |
Distance Nautical Miles |
Speed Knots |
Duration Hours |
Fuel consumption Main Engine Tons |
Fuel consumption Auxiliary Engine Boiler Tons |
Total Fuel consumption (Main Engine, Auxiliary Engine, Boiler) Tons |
|---|---|---|---|---|---|---|
| RW buoy MC buoy |
200.0 | 15.0 | 13.3 | 42.16 | 5.32 | 47.48 |
| Total | 0.00671 Ton/TEU |
| Leg | Distance Nautical Miles |
Speed Knots |
Duration Hours |
Fuel consumption Main Engine Tons |
Fuel consumption Auxiliary Engine Boiler Tons |
Total Fuel consumption (Main Engine, Auxiliary Engine, Boiler) Tons |
|---|---|---|---|---|---|---|
| RW buoy MC buoy |
200.0 | 15.0 | 13.3 | 42.69 | 5.32 | 48.01 |
| Total | 0.00628 Ton/TEU |
| Baseline Scenario Tons / TEU |
Scenario – Measure applied Tons / TEU |
Difference Tons / TEU / % |
| 0.00671 | 0.00628 | 0.00043 / 6,4 |
(speed optimization between ports)
For this calculation, the following assumptions have been made:
| Leg | Distance Nautical Miles |
Speed Knots |
Duration Hours |
Fuel consumption Main Engine Tons |
Fuel consumption Auxiliary Engine Boiler Tons |
Total Fuel consumption (Main Engine,Auxiliary Engine,Boiler) Tons |
|---|---|---|---|---|---|---|
| Berth 7 Fairway |
10.0 | VAR | 1.0 | 1.4 | 0.6 | 2.0 |
| Fairway RW buoy |
30.0 | 15.0 | 2.0 | 6.4 | 0.8 | 7.2 |
| RW buoy CIP |
190.0 | 19.0 | 10 | 60.4 | 0.0 | 60.4 |
| CIP MC buoy |
16.8 | 4.2 | 4.0 | 2.0 | 2.5 | 4.5 |
| Total | 74.1 |
| Leg | Distance Nautical Miles |
Speed Knots |
Duration Hours |
Fuel consumption Main Engine Tons |
Fuel consumption Auxiliary Engine Boiler Tons |
Total Fuel consumption (Main Engine, Auxiliary Engine, Boiler) Tons |
|---|---|---|---|---|---|---|
| Berth 7 Fairway |
10.0 | VAR | 1.0 | 1.4 | 0.6 | 2.0 |
| Fairway RW buoy |
30.0 | 15.0 | 2.0 | 6.4 | 0.8 | 7.2 |
| RW buoy CIP |
190.0 | 14.7 | 13.0 | 39.5 | 5.5 | 45.0 |
| CIP MC buoy |
16.8 | 14.7 | 1.1 | 3.5 | 0.7 | 4.2 |
| Total | 58.4 |
| Baseline Scenario Tons |
Scenario – Measure applied Tons |
Difference Tons / % |
|---|---|---|
| 74.1 | 58.4 | 15.7 / 21 |
This Guide is the product of a collaboration between the IMO-Norway GreenVoyage2050 Project and the Global Industry Alliance to Support Low Carbon Shipping (Low Carbon GIA).
Particular thanks are due to the entire GIA membership, as well as key industry stakeholders from more than 40 companies, organizations and industry associations that were invited to contribute to this work and provided important input and support. A list of all contributing entities is set out below.
Great thanks are also due to:
The views expressed in this Guide are those of the authors and do not necessarily represent the opinion of the organizations they work for, or any organization that provided inputs as per list of contributing entities below.
List of entities that provided inputs (Low Carbon GIA members are highlighted in bold):
ABB
APM Terminals
Association of Bulk Terminal Operators (ABTO)
BIMCO
BP Shipping
Bureau Veritas Marine & Offshore SAS
Cargill
Digital Container Shipping Association (DCSA)
DNV SE
Exmile Solutions Ltd
Federation of National Associations of Ship Brokers & Agents (FONASBA)
Grimaldi Group
Hamburg HVCC
HPA Hamburg
Inchcape Shipping Services
International Association of Dry Cargo Shipowners (INTERCARGO)
International Association of Ports and Harbors (IAPH)
International Cargo Handling Coordination Association (ICHCA)
International Chamber of Shipping (ICS)
International Federation of Shipmasters’ Associations (IFSMA)
International Harbour Masters Association (IHMA)
International Parcel Tankers Association (IPTA)
International Ship Suppliers Association (ISSA)
A.P. Moller-Maersk A/S
MPA Singapore
MSC Mediterranean Shipping Company S.A.
Nautical Institute
North Sea Port
Port of Gothenburg
Port of Oostende
Port of Rotterdam
Port of Tanger Med
PortXchange
Royal Caribbean Cruises Ltd
Shell International Trading and Shipping Company Ltd
Silverstream Technologies (UK) Ltd
Stena AB
Stolt Tankers B.V.
Swedish Maritime Administration
Terminal Investment Ltd
Torm A/S
Total Marine Fuels Pte Ltd
Wärtsilä Corporation
World Ports Climate Action Program (WPCAP)
Users of this content should be aware that references to IMO instruments may become out of date by the adoption of more recent instruments. Users are therefore invited to consult their national maritime administration or the IMO website for information on the status of referenced instruments.
Links and references to third party websites do not imply any official endorsement of or responsibility on the part of IMO for the opinions, ideas, data or products presented at these locations, or guarantee the validity of the information provided.
IMO, the Norwegian Ministry of Climate and Environment or the members of the GIA shall not be liable to any person or organization for any loss, damage or expense caused by reliance on the information or advice in this document or howsoever provided.